Currently, for languages with separate population sizes listed for different speaker communities, it just extracts the total sum of speakers. Some entries also indicate a date for the population figure, which is currently ignored, but could also be retrieved to consider the diachrony of population sizes (though only across languages).
So far I've retrieved population figures for all of the languages covered by the publicly downloadable portion of the Autotyp database of genealogical and geographical information. All of those with usable ISO codes, that is, grr. So it's about 2,400 languages, and the data are here. [Update: check out the newer data on 6,305 languages.] In the future, I'll just retrieve the population figures from all Ethnologue entries that include them. In the meantime, let's look at some plots.
Here's a rank-ordered plot of the population sizes:  It's very skewed, with a few large languages, and a long tail of small languages. Pretty much par for the course in linguistics.
So let's look at that on log-log axes. We might wonder if it's some sort of power law.  Oy, not really. This would be a straight line if it were a power law. It looks like there might be a glimmer of straightness on the left side of the curve, but it quickly falls away to a sub-exponential relationship. If we just focus on the first 500 most populous languages, we can see that it's close to something like a power law, but there is significant systematic divergence:
 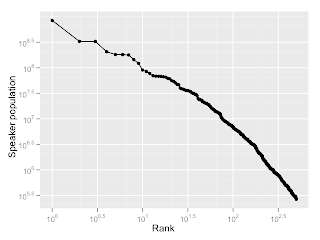 And for completeness, let's look at the tail of the 500 least populous languages, this time on linear axes:
You can see that the tail has variable slope, and a definite flattening around the sub-100 speakers mark.
Anyway, it's a simple thing, but neat to have the data. Hopefully future posts will explore some more interesting or useful aspects of it.
No comments:
Post a Comment